7.5 kmeans demo iris
20211016
The third example illustrates k-means on the common Iris dataset. Because the data has four dimensions, we perform a principle components analysis (PCA) to reduce to two dimensions (the two most important components) to plot the data.
=======================
K-Means Iris Clustering
=======================

Cluster the common iris dataset. To visualise the data we first do a
principle component analysis to map to the two most important
components, to suit a 2D plot which we display. The points are
coloured according the the iris species.

Close the graphic window using Ctrl-W.

Press Enter to continue: 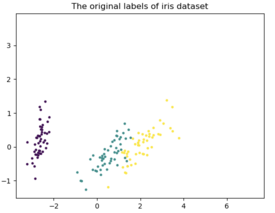
Next we visualise the algorithm clustering this dataset.

Close the graphic window using Ctrl-W.

Press Enter to exit: 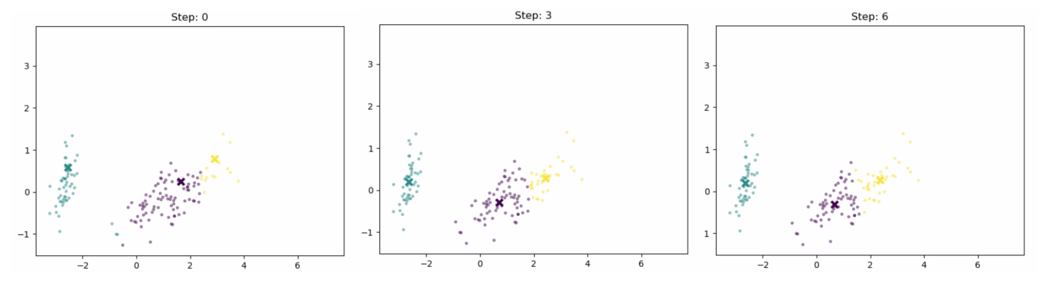
Your donation will support ongoing availability and give you access to the PDF version of this book. Desktop Survival Guides include Data Science, GNU/Linux, and MLHub. Books available on Amazon include Data Mining with Rattle and Essentials of Data Science. Popular open source software includes rattle, wajig, and mlhub. Hosted by Togaware, a pioneer of free and open source software since 1984. Copyright © 1995-2022 Graham.Williams@togaware.com Creative Commons Attribution-ShareAlike 4.0